|
|
 |
 |
 Programming Programming |
Reporting |
Sample |
Data Processing |
Analysis |
|
|
|
|
 Online Reporting Online Reporting
Monitor your data collection 24/7 in real-time
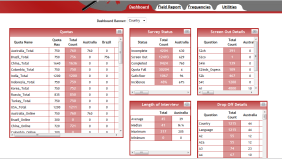
The dashboard provides you all of your data collection metrics on one screen. It includes:
- Total number of completes, terminates, Over-quota, partials, and satisficers
- Individual Quota Counts
- Interview Length mean, median, min, and max
- Termination counts by question
- Drop-off counts by question
A banner can be included to group the metrics by recruiting partner or in response to one or more survey questions (i.e. country or region). The banners are managed by user so you can control what each partner or client sees.
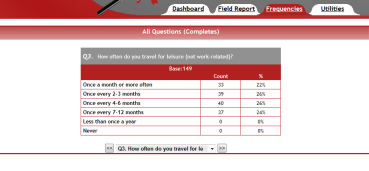
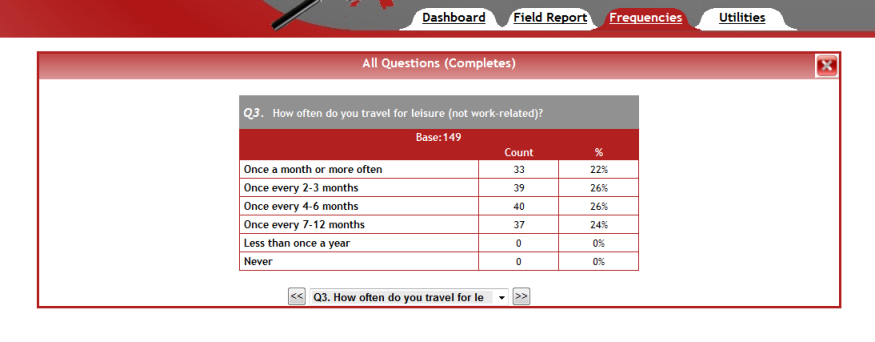
You can view topline results on your data with the frequency reports. The reports include extensive filtering options allowing you to determine which records are included in each report. There is no limit to the number of reports and you can control who has view and edit access to each. The tables can be easily copied into an email, Powerpoint, or Word.
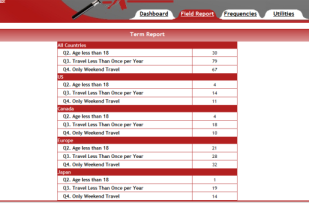
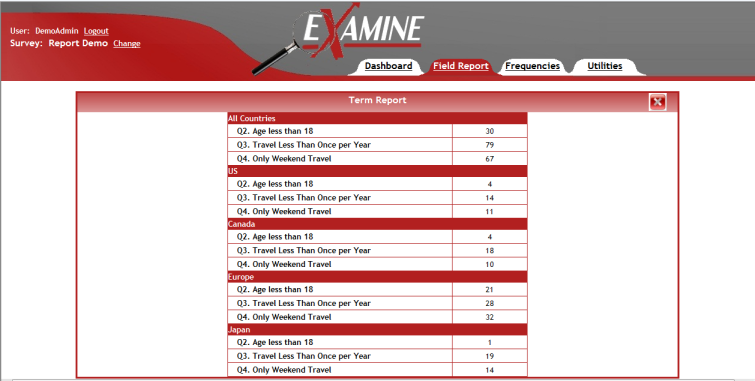
Customized reports are available to give you a simple one-page report of all the important counts you need to monitor while in field. The field reports make it easy to track complex quota structures, multiple incidence groups, or multiple methodologies.
Your data is available to you 24/7 in the exact format that you request. We set up the layout and form (fully-labeled SPSS, flat-ascii, Excel) according to your requirements prior to launch so you have one-click access to the data exactly as you want it. You can have as many different layouts and formats as you require. We are checking your data every day to validate programming logic and respondent integrity, so the data you download is as clean as possible.
|
|
|
|
|
|